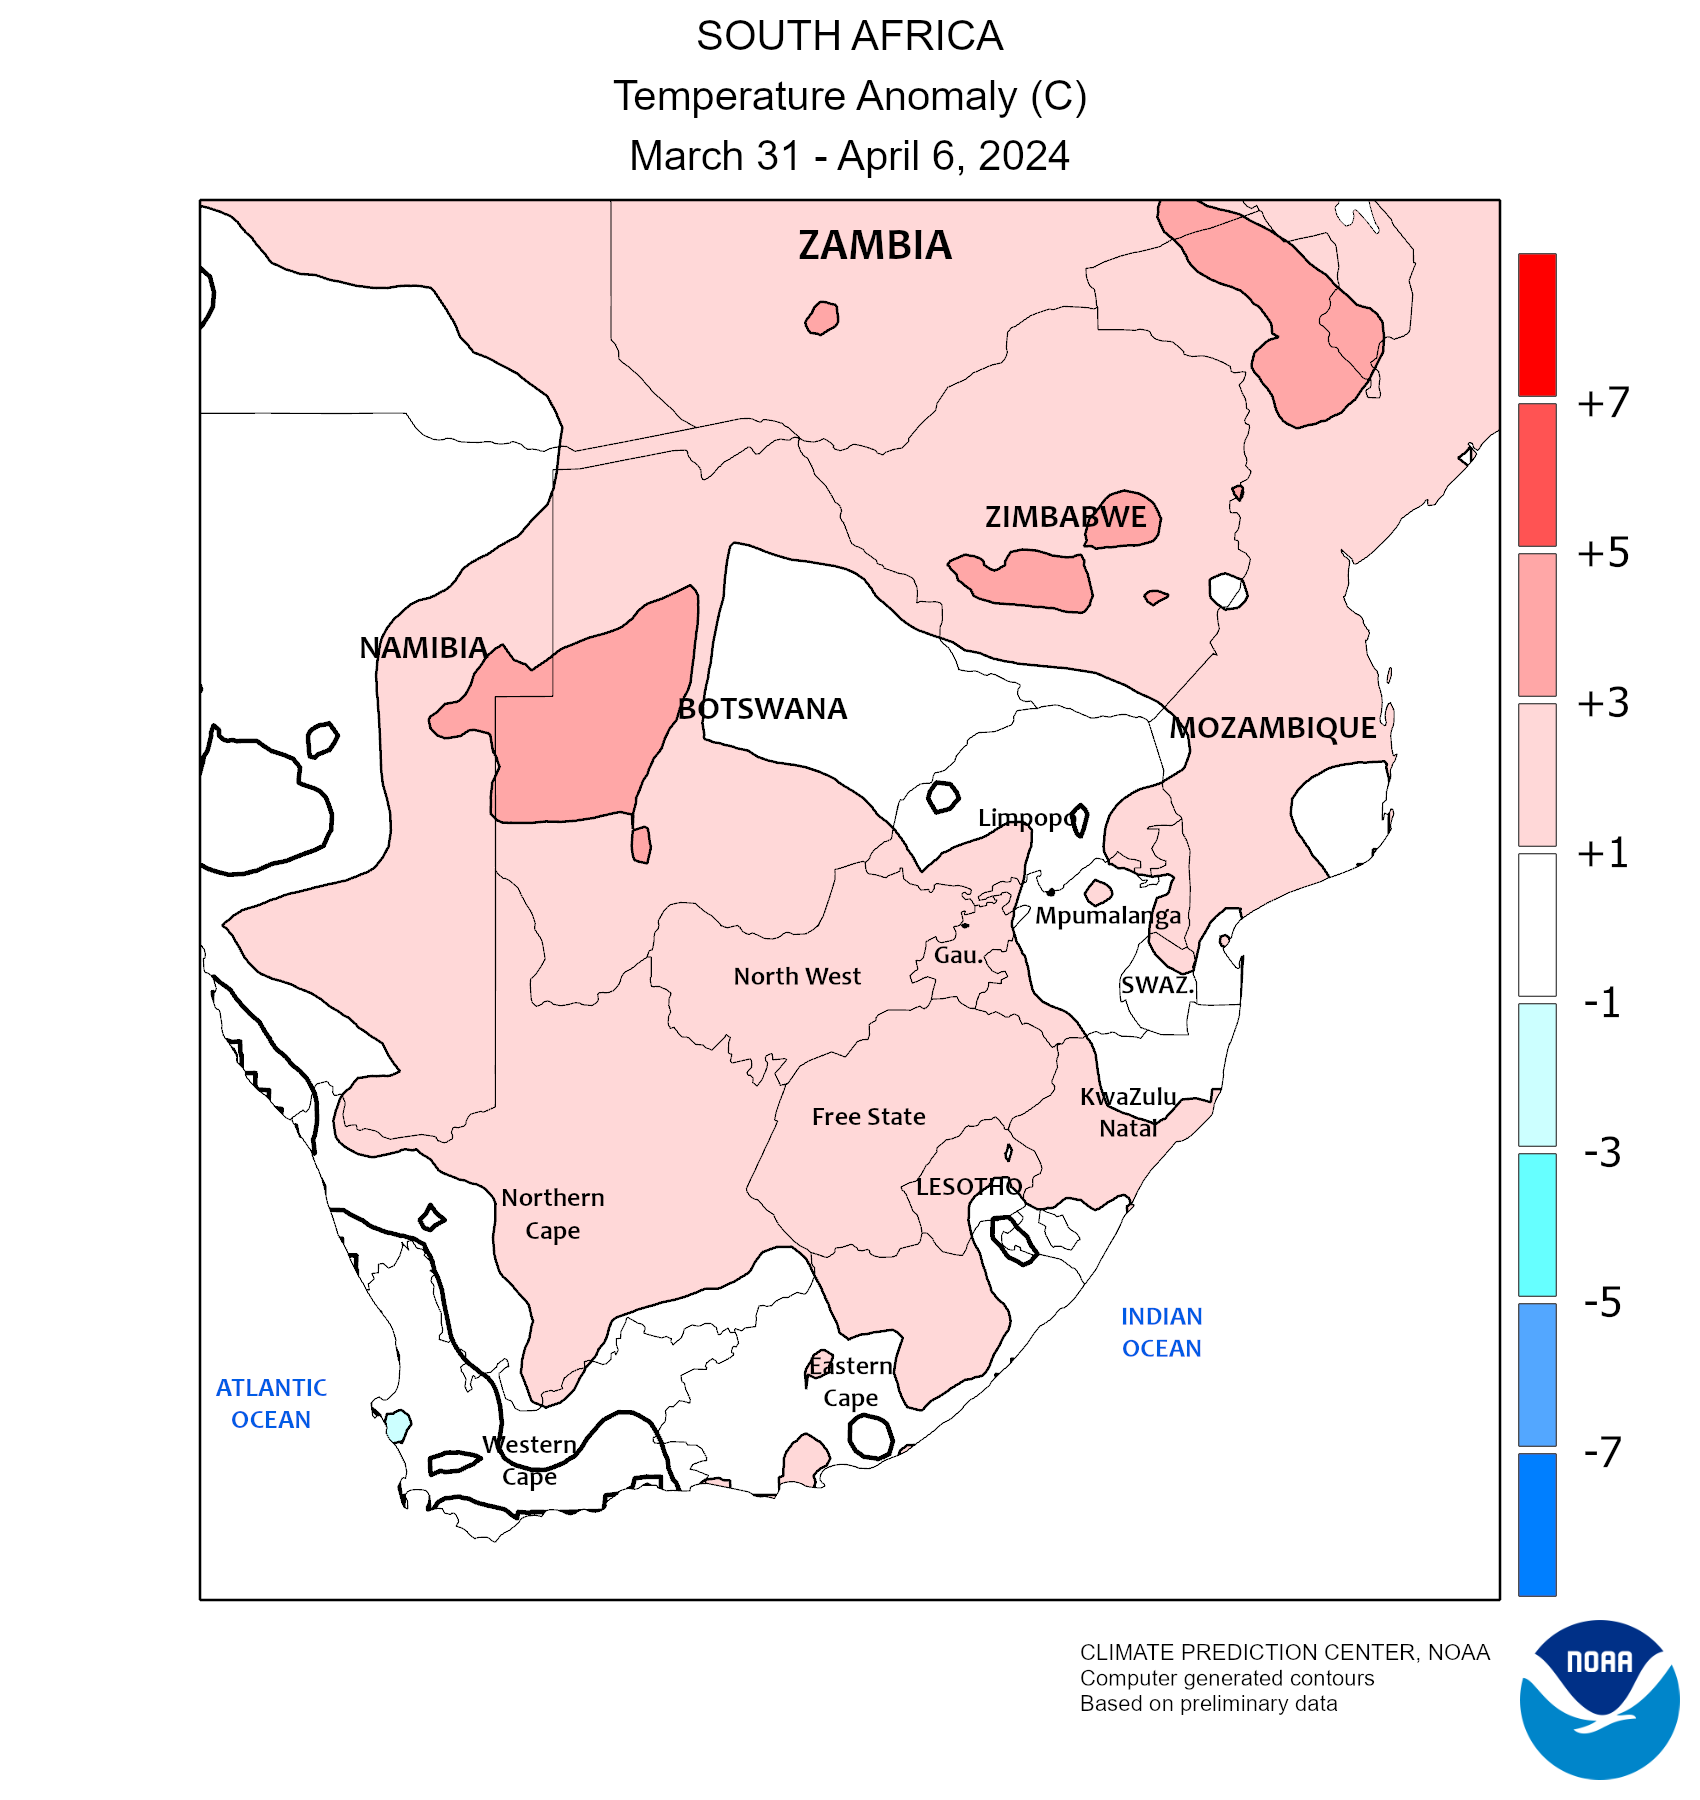
From
|
National Weather
Service
Climate Prediction Center
Regional Climate Maps :
South Africa |
|
|
Weekly |
|

Weekly Maximum Temperature |

Weekly Minimum Temperature |

Weekly Temperature Anomaly |

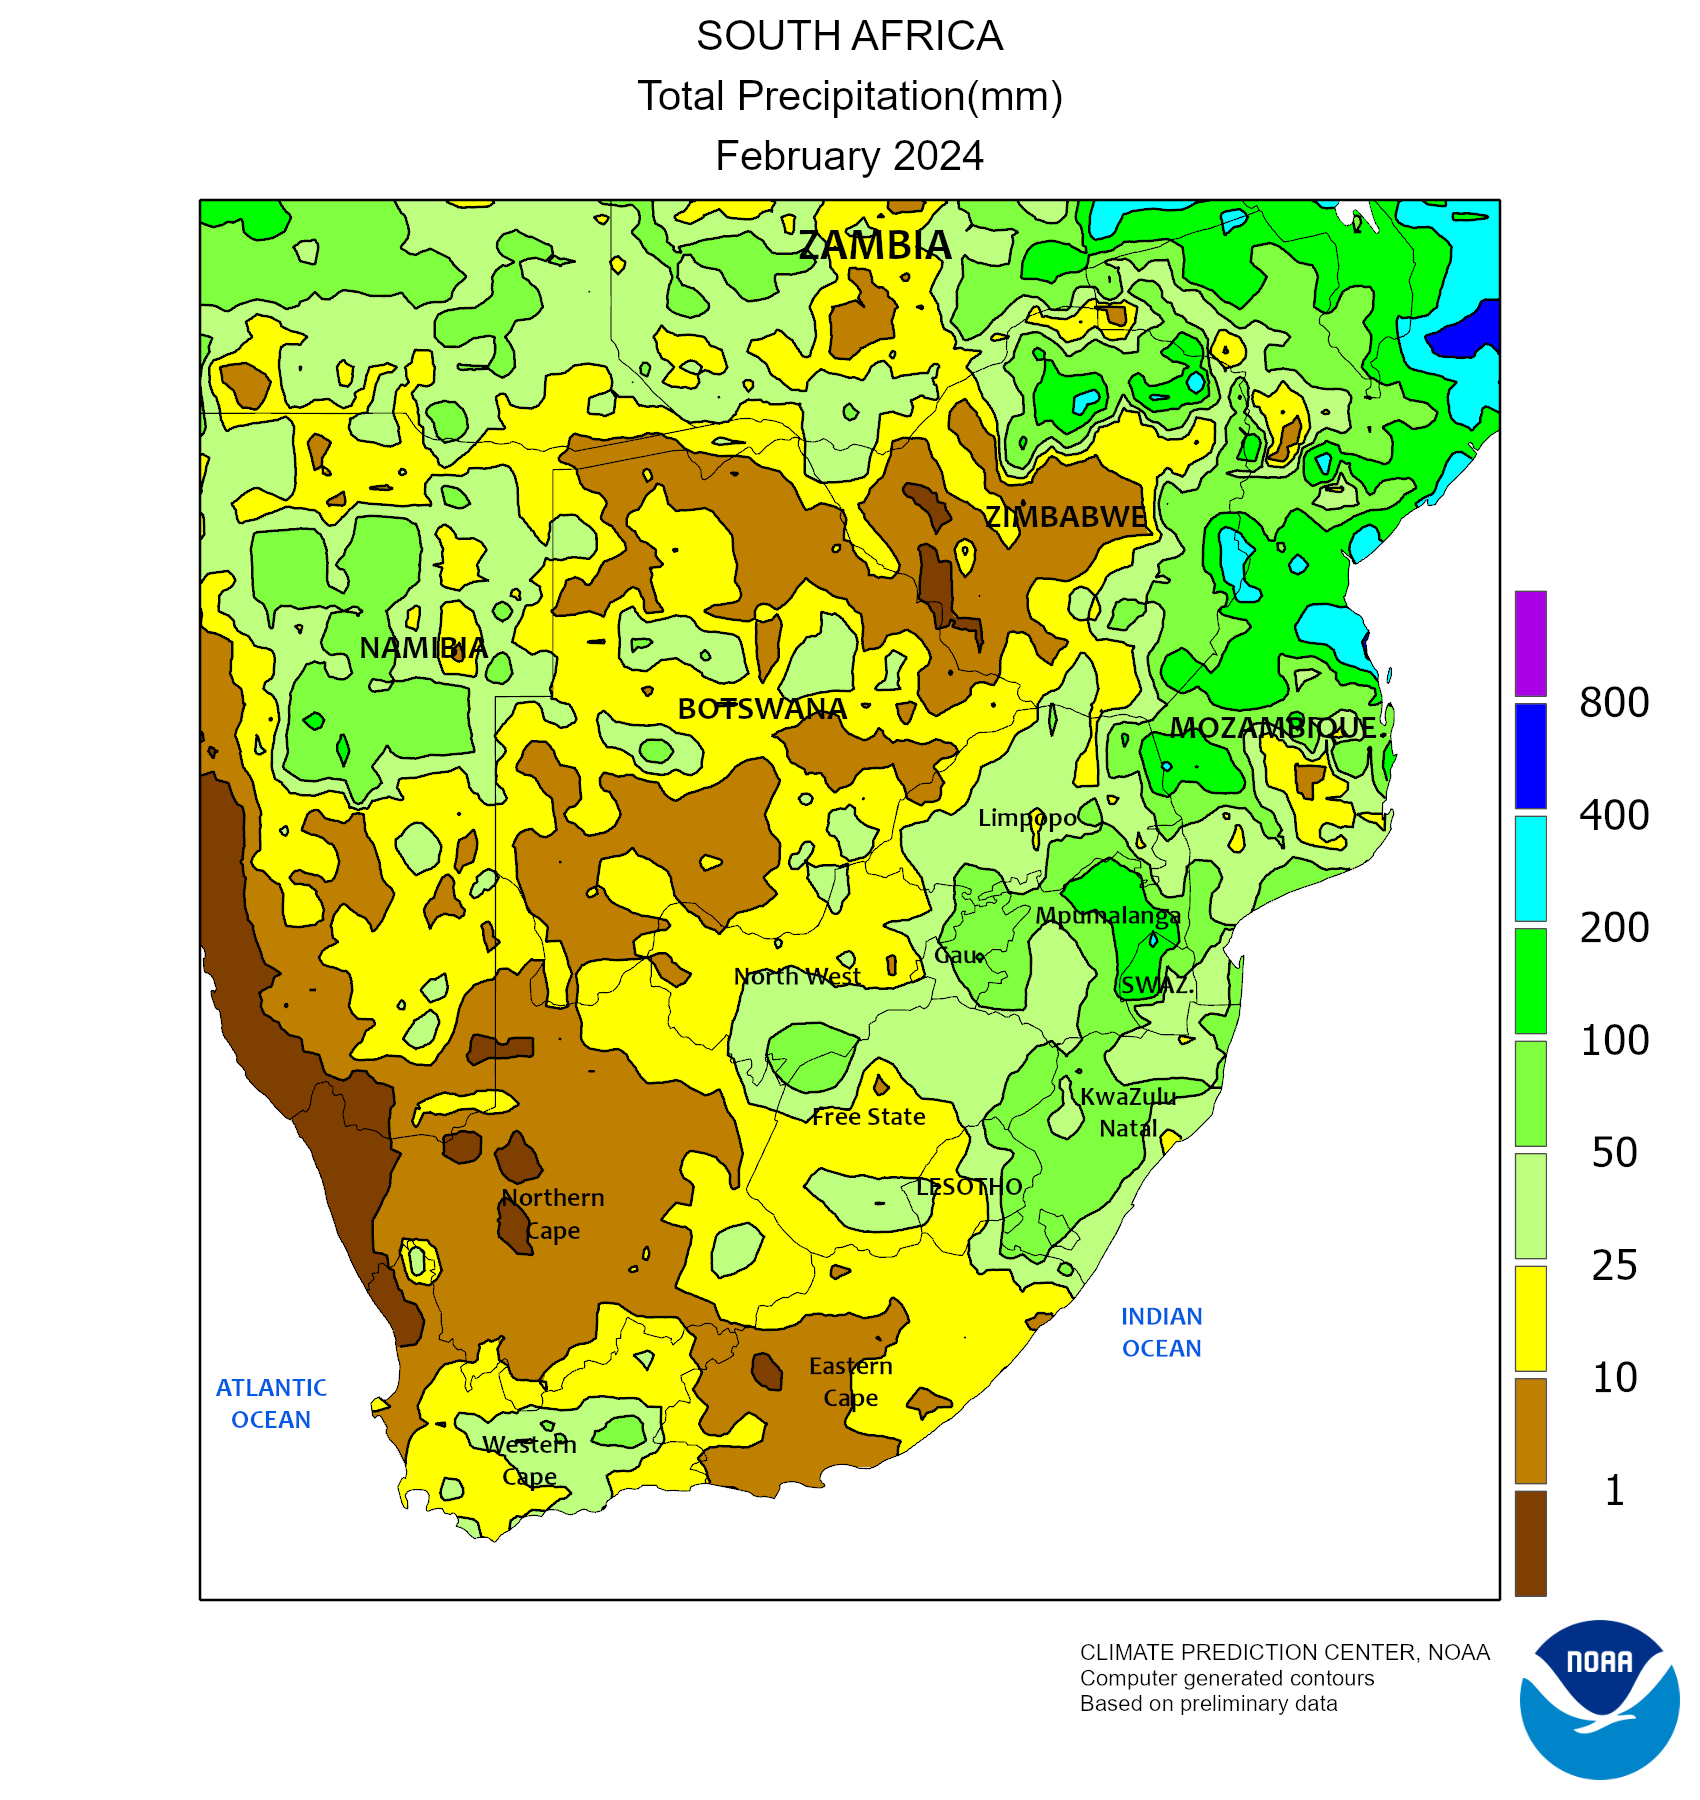
Weekly Total Precipitation |
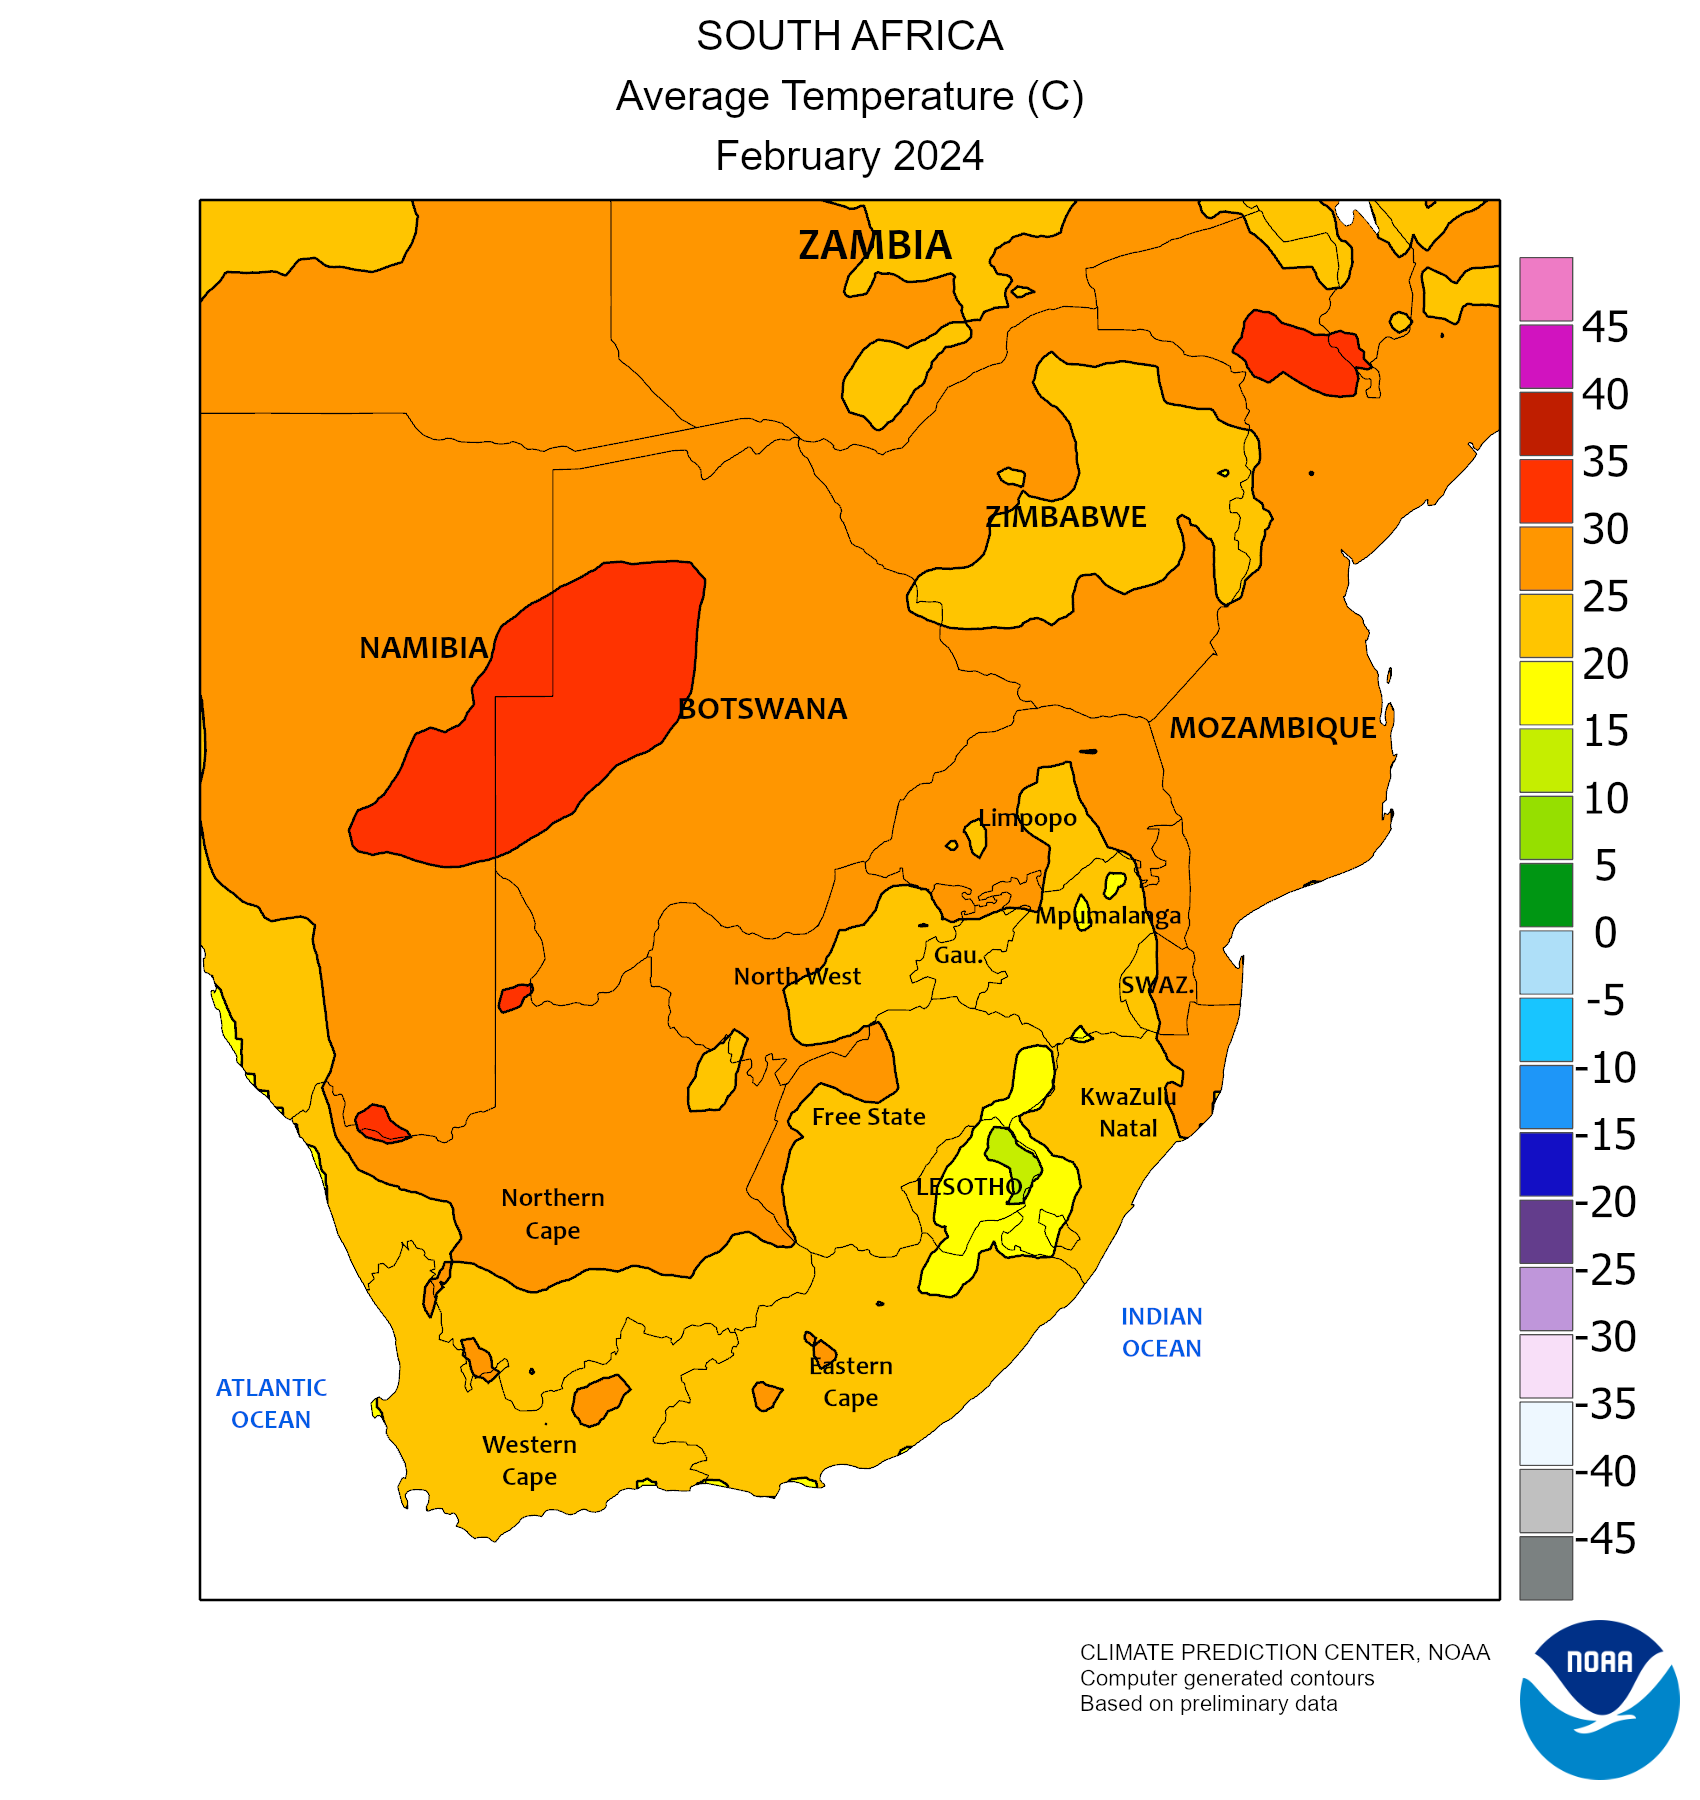
| Monthly |
|

Monthly Total Precipitation |

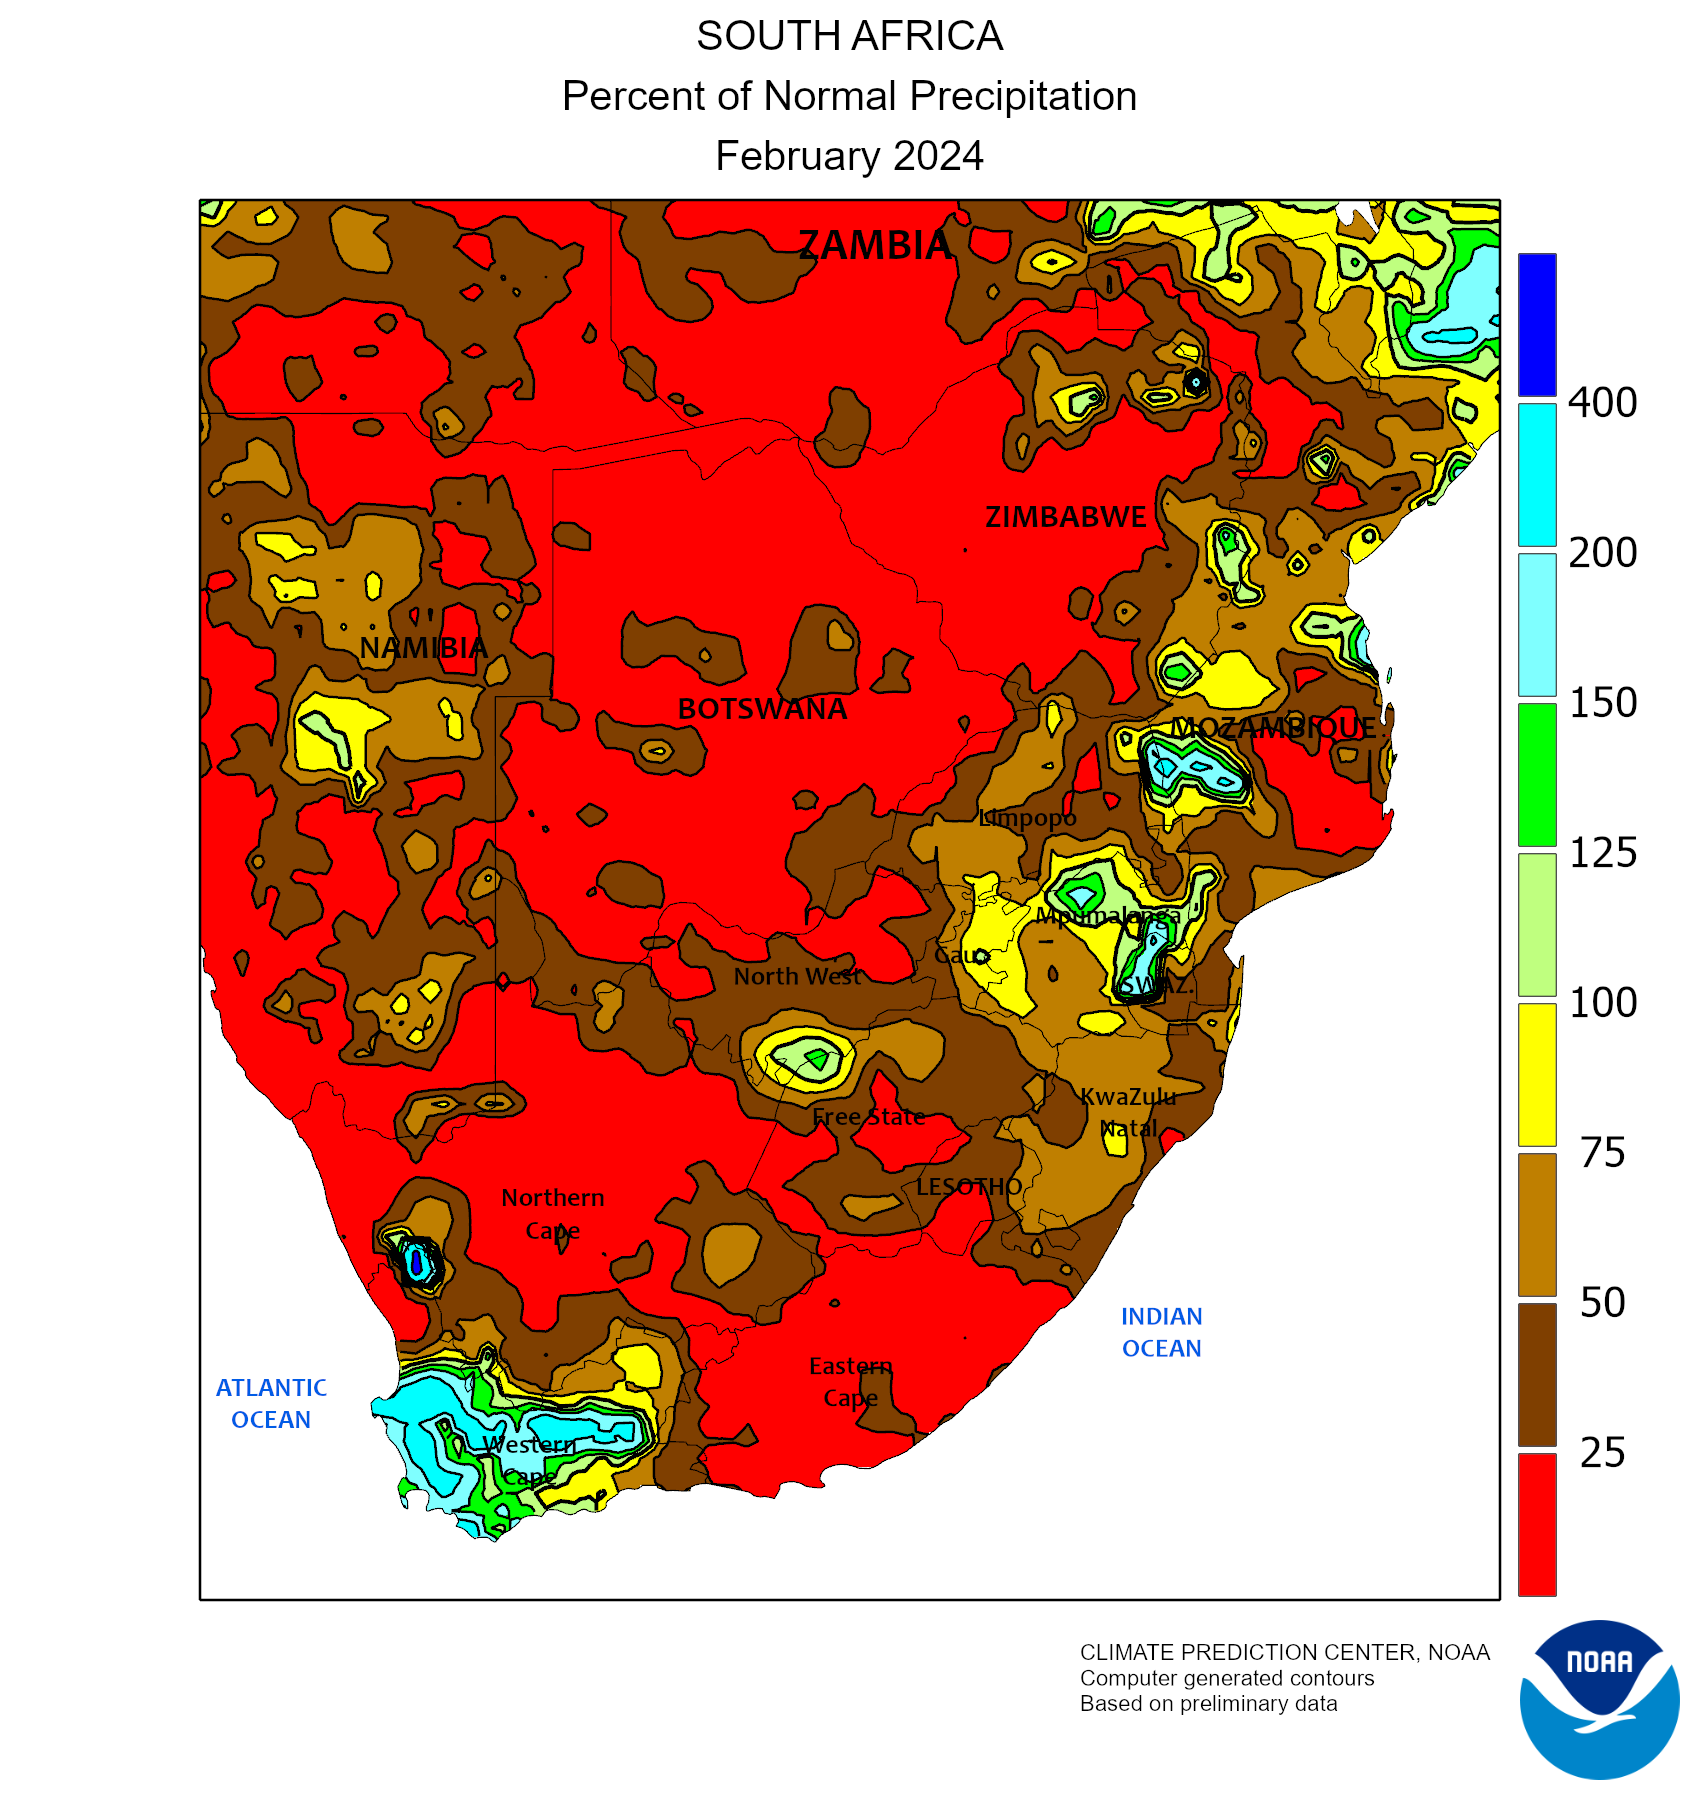
Monthly Percent of Normal precipitation |
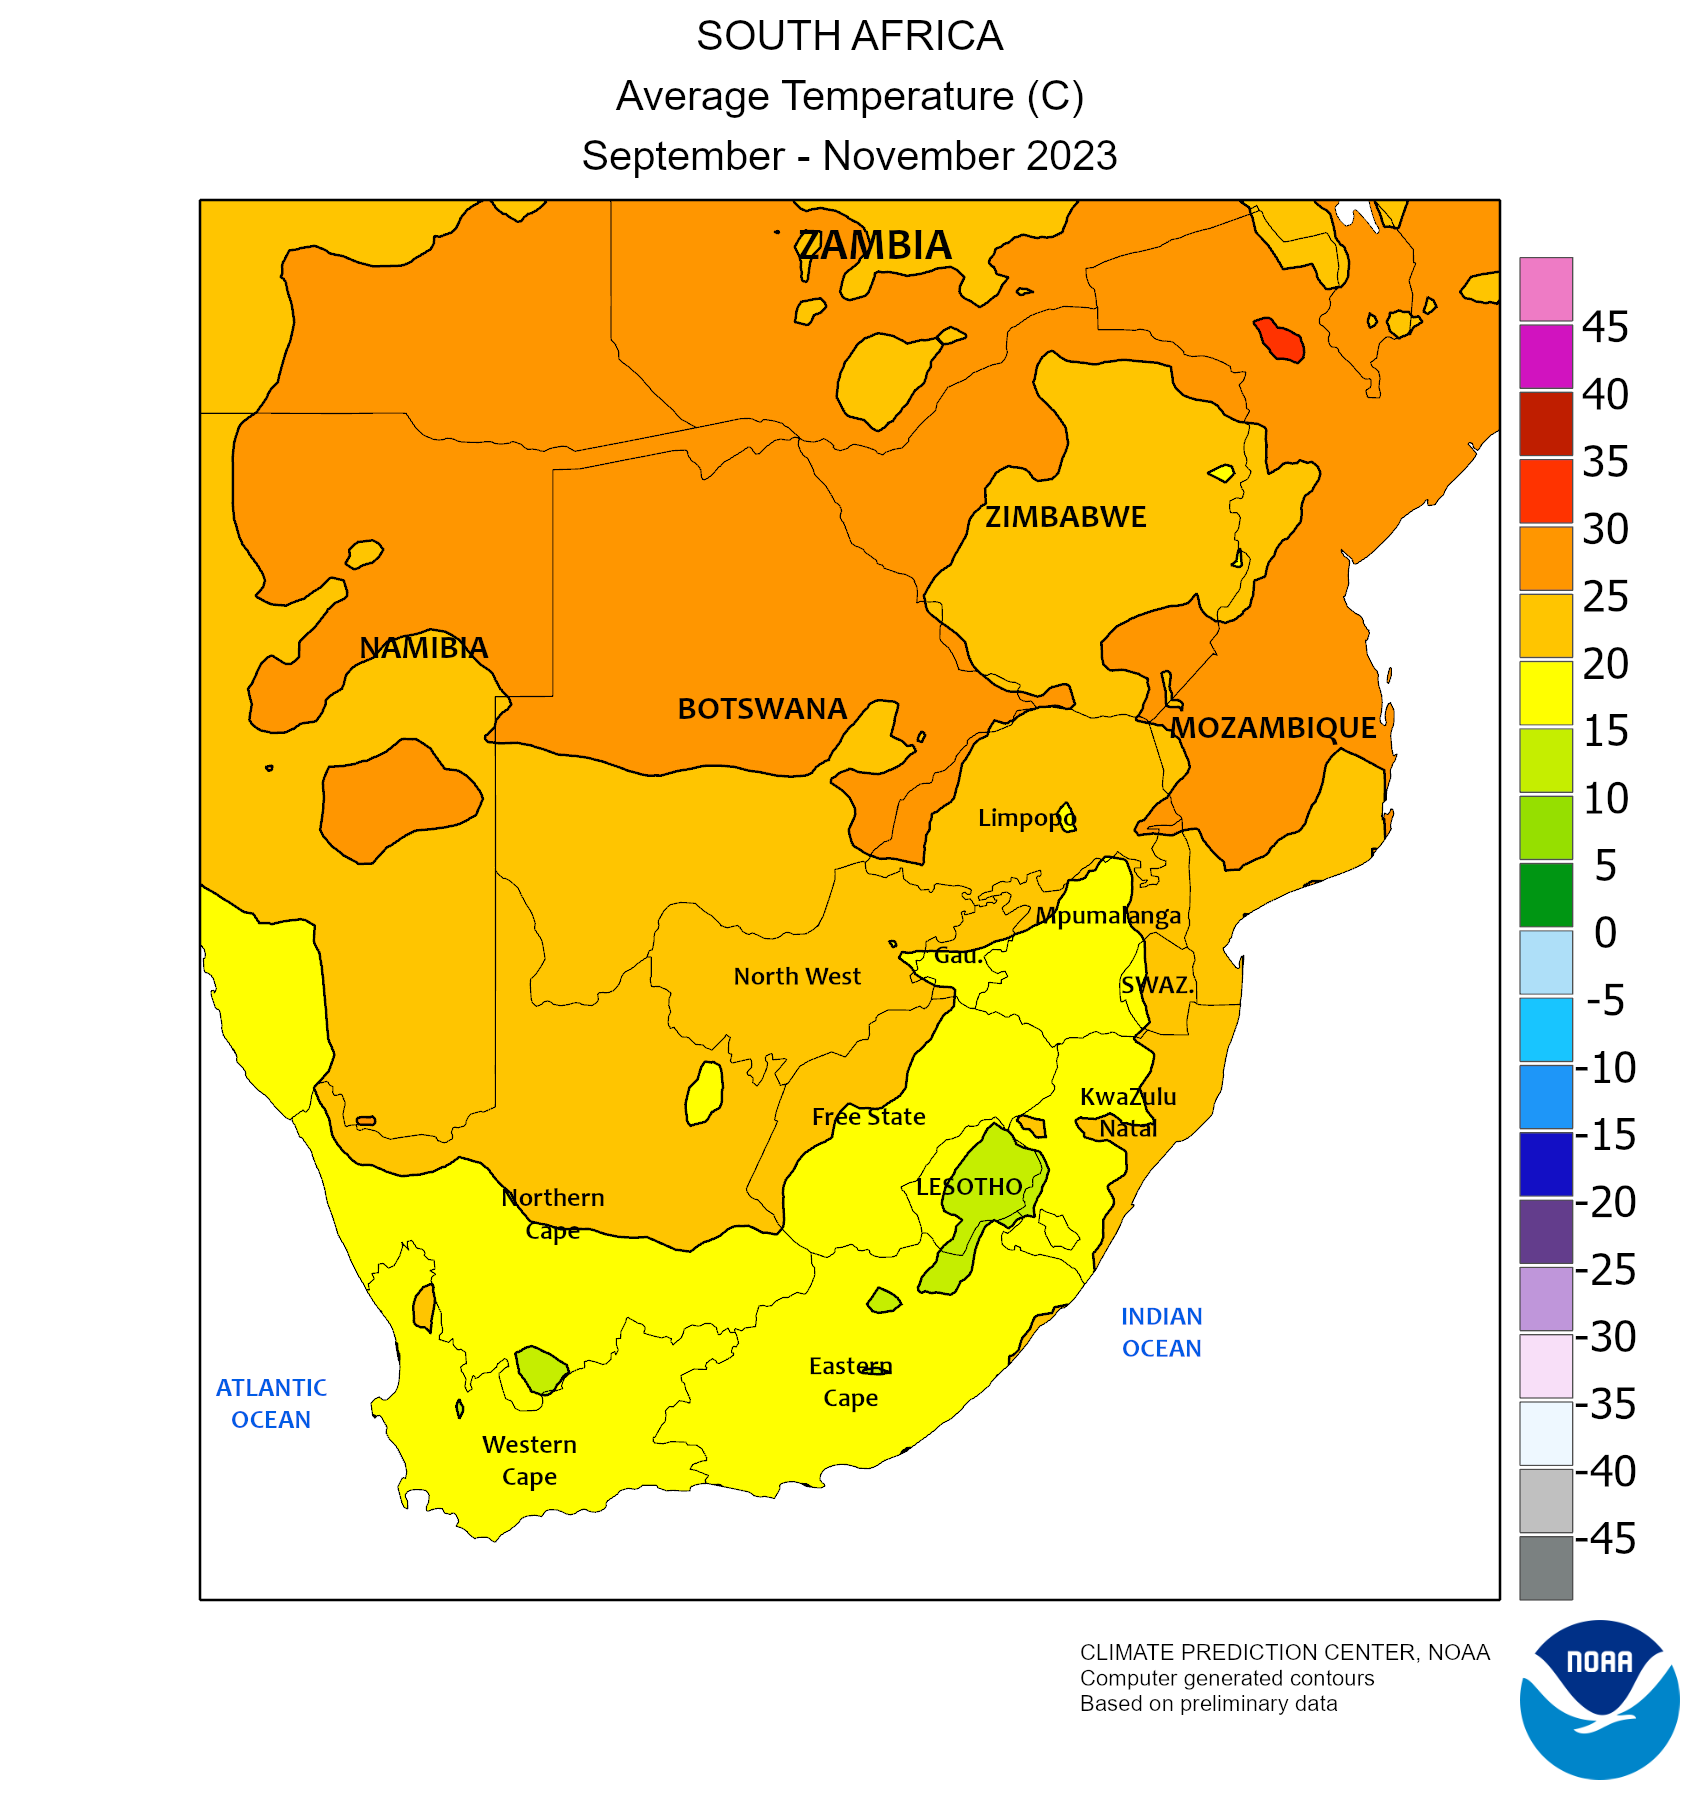
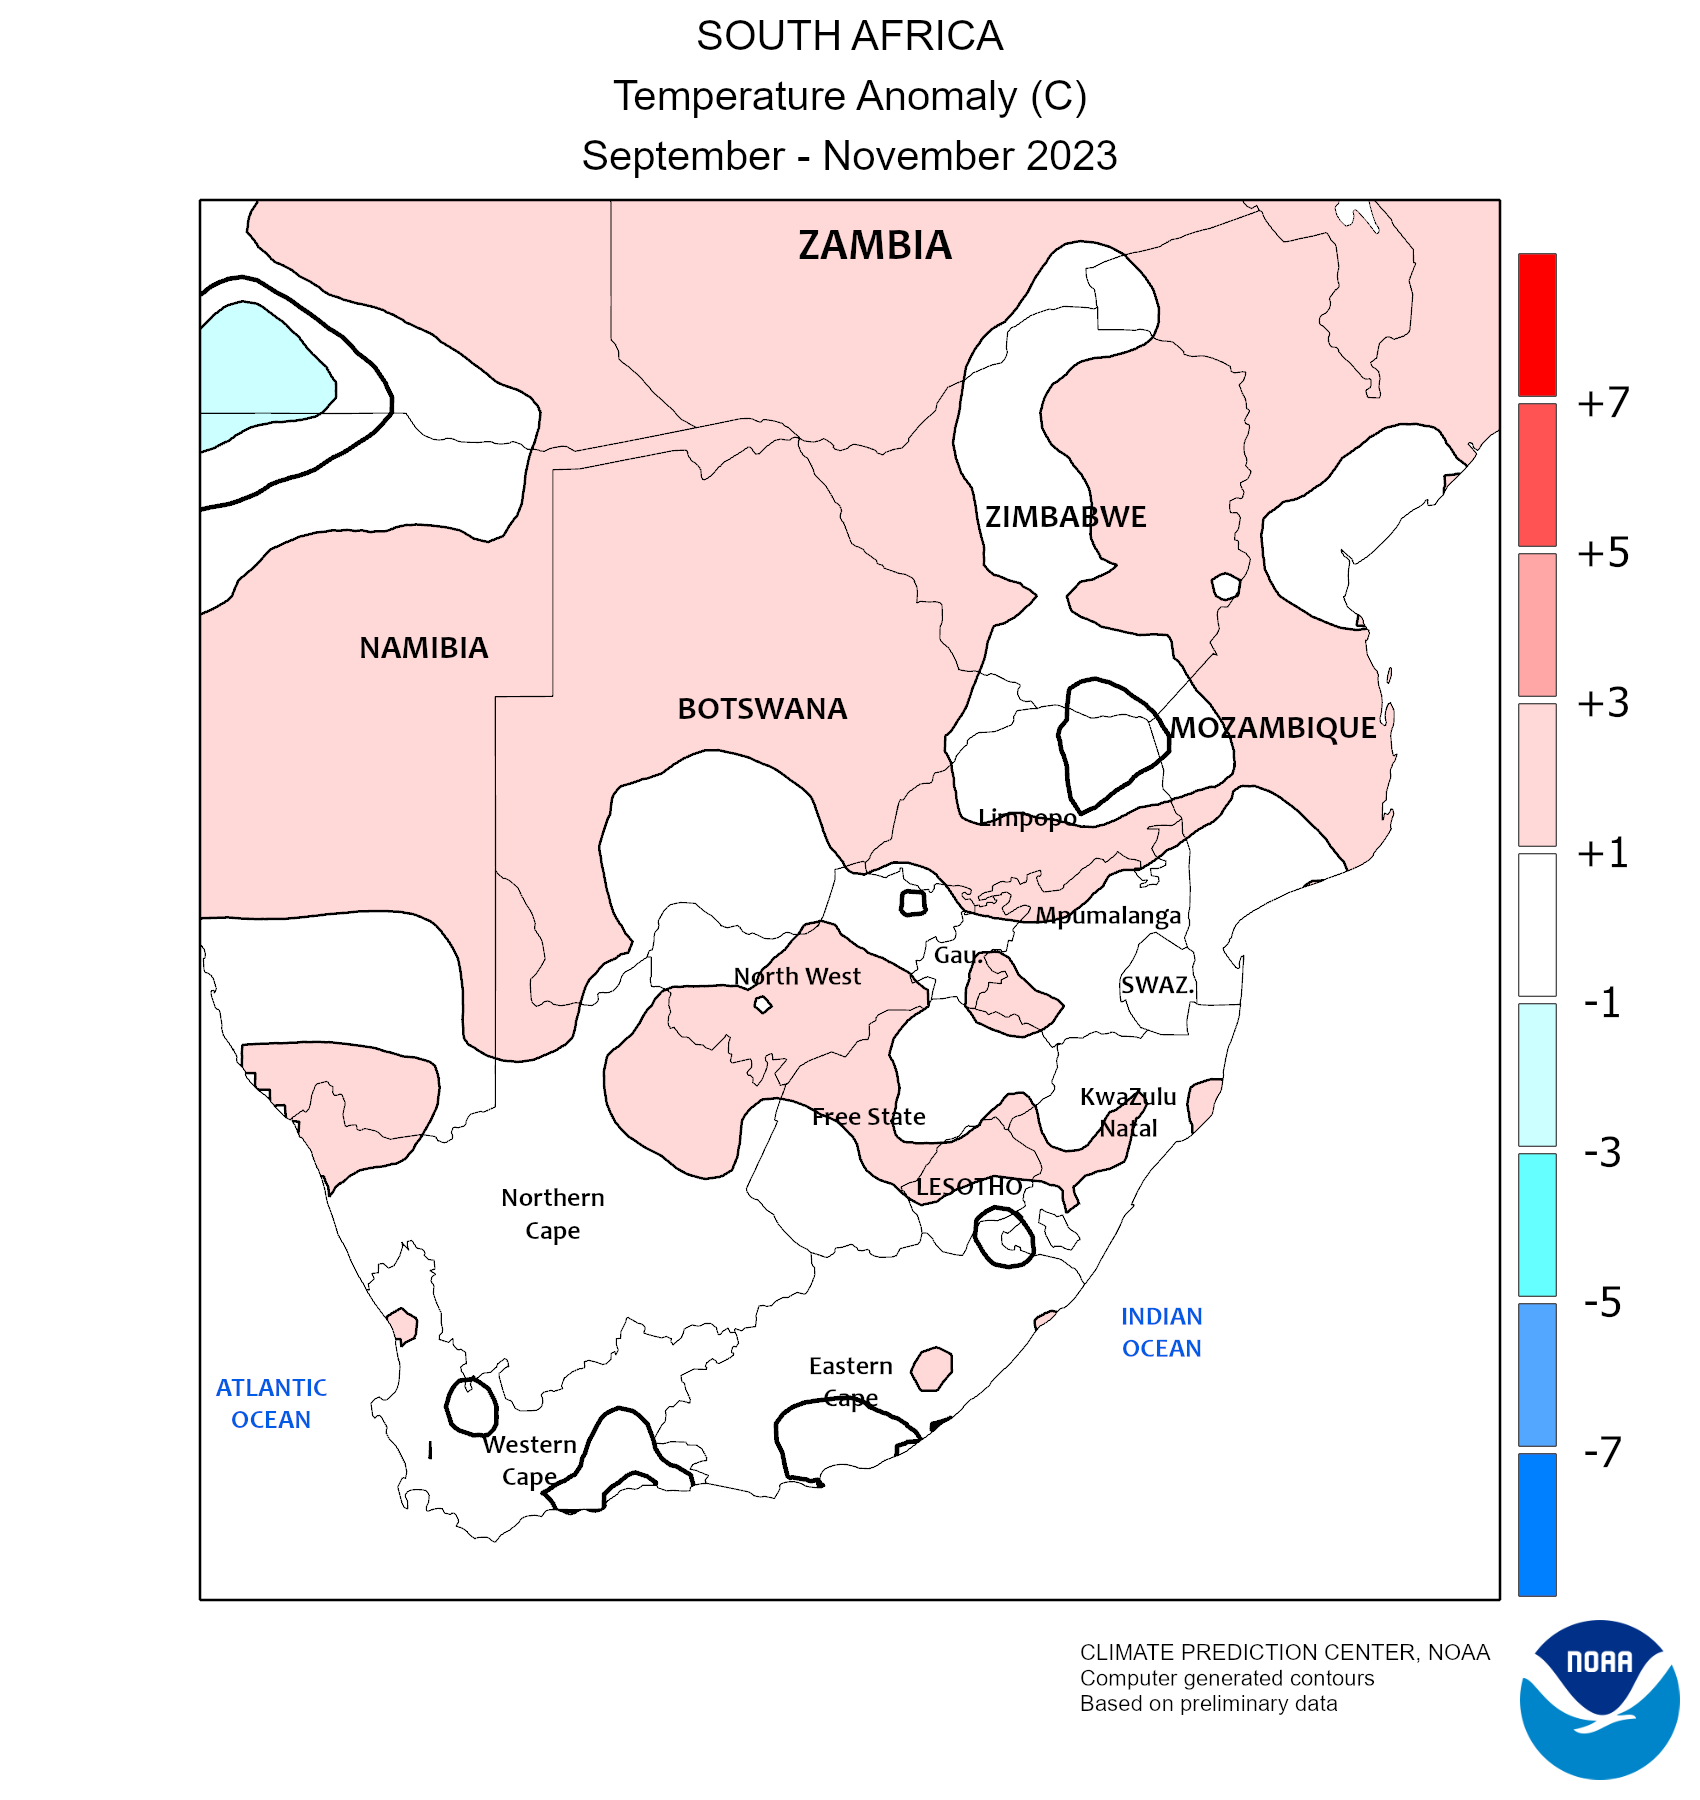
Monthly Average Temperature |

Monthly Temperature Anomaly |
| 3 Month |
|

3 Month Total Precipitation |

3 Month Percent of Normal precipitation |

3 Month Average Temperature |

3 Month Temperature Anomaly |